Ipynb test
Ipynb Summary
In [1]:
x = 2
y = 4
Code cell that should compute $x^y$:
In [2]:
print(x ** y)
THIS CELL SHOULD BE HIDDEN
Some horrible code...
In [3]:
%matplotlib inline
print("Some horrible code is here")
In [4]:
import matplotlib.pyplot as plt
# plt.style.use('default')
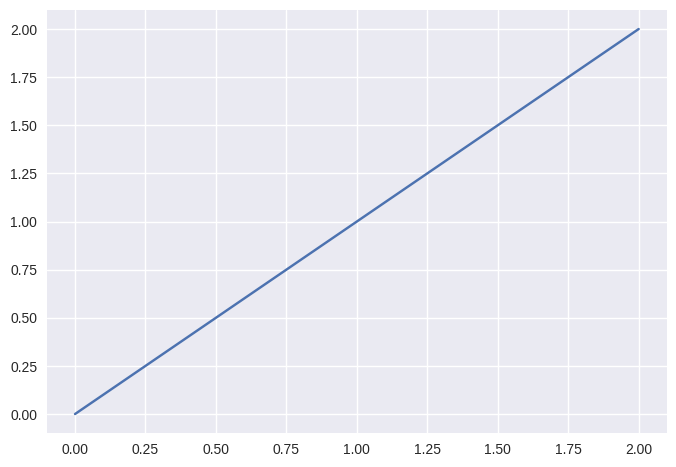
plt.style.use('seaborn')
# hmm, classic has nice greyish background
# but seaborn uses more ticks?
import numpy as np
x = np.linspace(0, 2, 100)
plt.plot(x, x, label='linear')
plt.show()
In [5]:
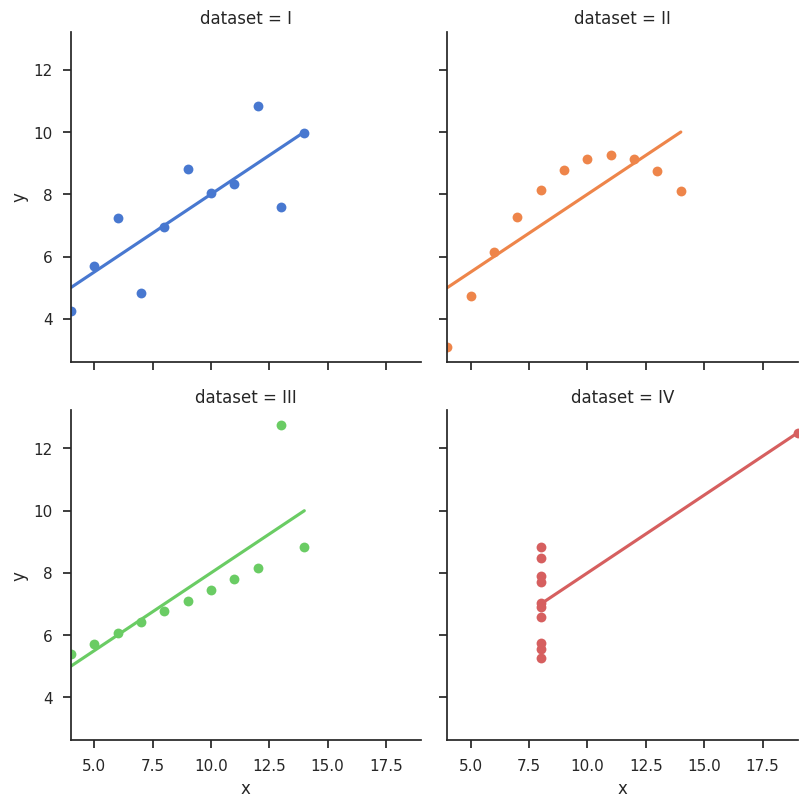
# demo from https://seaborn.pydata.org/examples/anscombes_quartet.html
#
import seaborn as sns
sns.set(style="ticks")

# Load the example dataset for Anscombe's quartet
df = sns.load_dataset("anscombe")

# Show the results of a linear regression within each dataset
sns.lmplot(x="x", y="y", col="dataset", hue="dataset", data=df,
           col_wrap=2, ci=None, palette="muted", height=4,
           scatter_kws={"s": 50, "alpha": 1})

# TODO ugh. we don't really need plt.show, but then it dumps smth. like
# <seaborn.axisgrid.FacetGrid at 0x7f7c5cbf84a8>
# how to get rid of it?
plt.show()