Quantifying quantified-mind.com
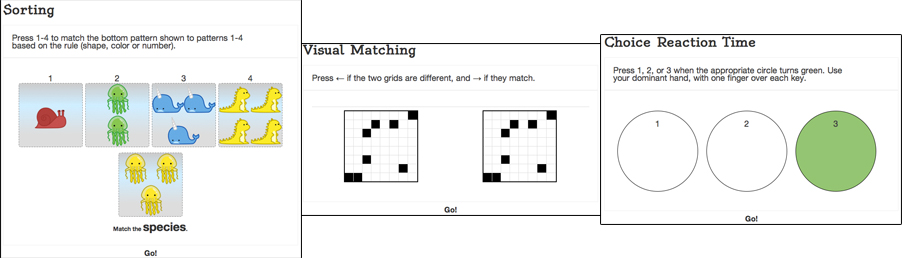
Quantified Mind is a website which provides a handful of cognitive tests. It lets you choose a bunch of tests and you can run them whenever you wish, adding quantitative variables you are measuring alongside (e.g. hours of sleep, or cups of coffee you drank) or just arbitrary notes. Here is how it looks like.
Why is it interesting? If you are like me and don’t feel any obvious/significant subjective effects of conventional stimulants, sleep or exercise, it would be great to have some objective measure in case the effects are subtle but present. For you it could be saving half an hour of sleep per night by using melatonin, or realizing coffee doesn’t have effect on your cognitive performance, or something else.
That sounded pretty interesting to me, and I started taking some tests (simple reaction time, visual matching, sorting and 1-back). However, given that effects are subtle in the first place, I wasn’t expecting to get any insights by gazing at collected data, so I needed to make sure I can export my experiments to run some sort of regression on them later.
To my disappointment, when I ran thirty or something sessions and exported the CSV, it didn’t have error rate/reaction time, but you are only getting some magical ‘score’. It was unclear what it meant from the FAQ so I emailed the authors and got a response:
As for scores - it's a calculation that involves everything in a test, so for simple reaction time it involves both reaction times
and accuracy.
The actual formulas aren't available, but the instructions are always simple: go for accuracy first, and try to be as fast as you can
without sacrificing accuracy.
“Formulas aren’t available” was quite unsatisfactory to me. What are they actually measuring? So before carrying on and collecting more data I tried to reverse engineer the model.
Implementation
The idea was simple: choose couple of tests that are easy to automate via Selenium Webdriver. Automation was necessary to collect lots of data corresponding to different input performance characteristics.
In essence:
- I’m varying average reaction time (delay) and number of errors (which I make deliberately)
- then I generate a bit of Javascript and inject it into the browser via Selenium.
- once the automated test session is finished, I recorded the score for further analysis.
Thankfully, the website is not using flash and is not heavy on obfuscation, so interacting with elements via javascript was fairly easy.
If you wanna experiment by yourself, here’s the repository and if you don’t feel like running the scripts for a day to collect data, I also uploaded it to releases.
Tests
I’ve chosen “Simple reaction time” and “Visual matching”. From the “science” section:
The first is “Simple Reaction Time,” which assesses how quickly a person can respond to a single stimulus (a circle that turns
from white to green) by pressing the space bar.

“Visual Matching” places two highlighted grids next to one another and asks a person to judge, as quickly as possible, whether
the two grids are identical.
Results
TLDR: I find the models pretty weird.
Here is the demo of my script that extracted scores from the tests:
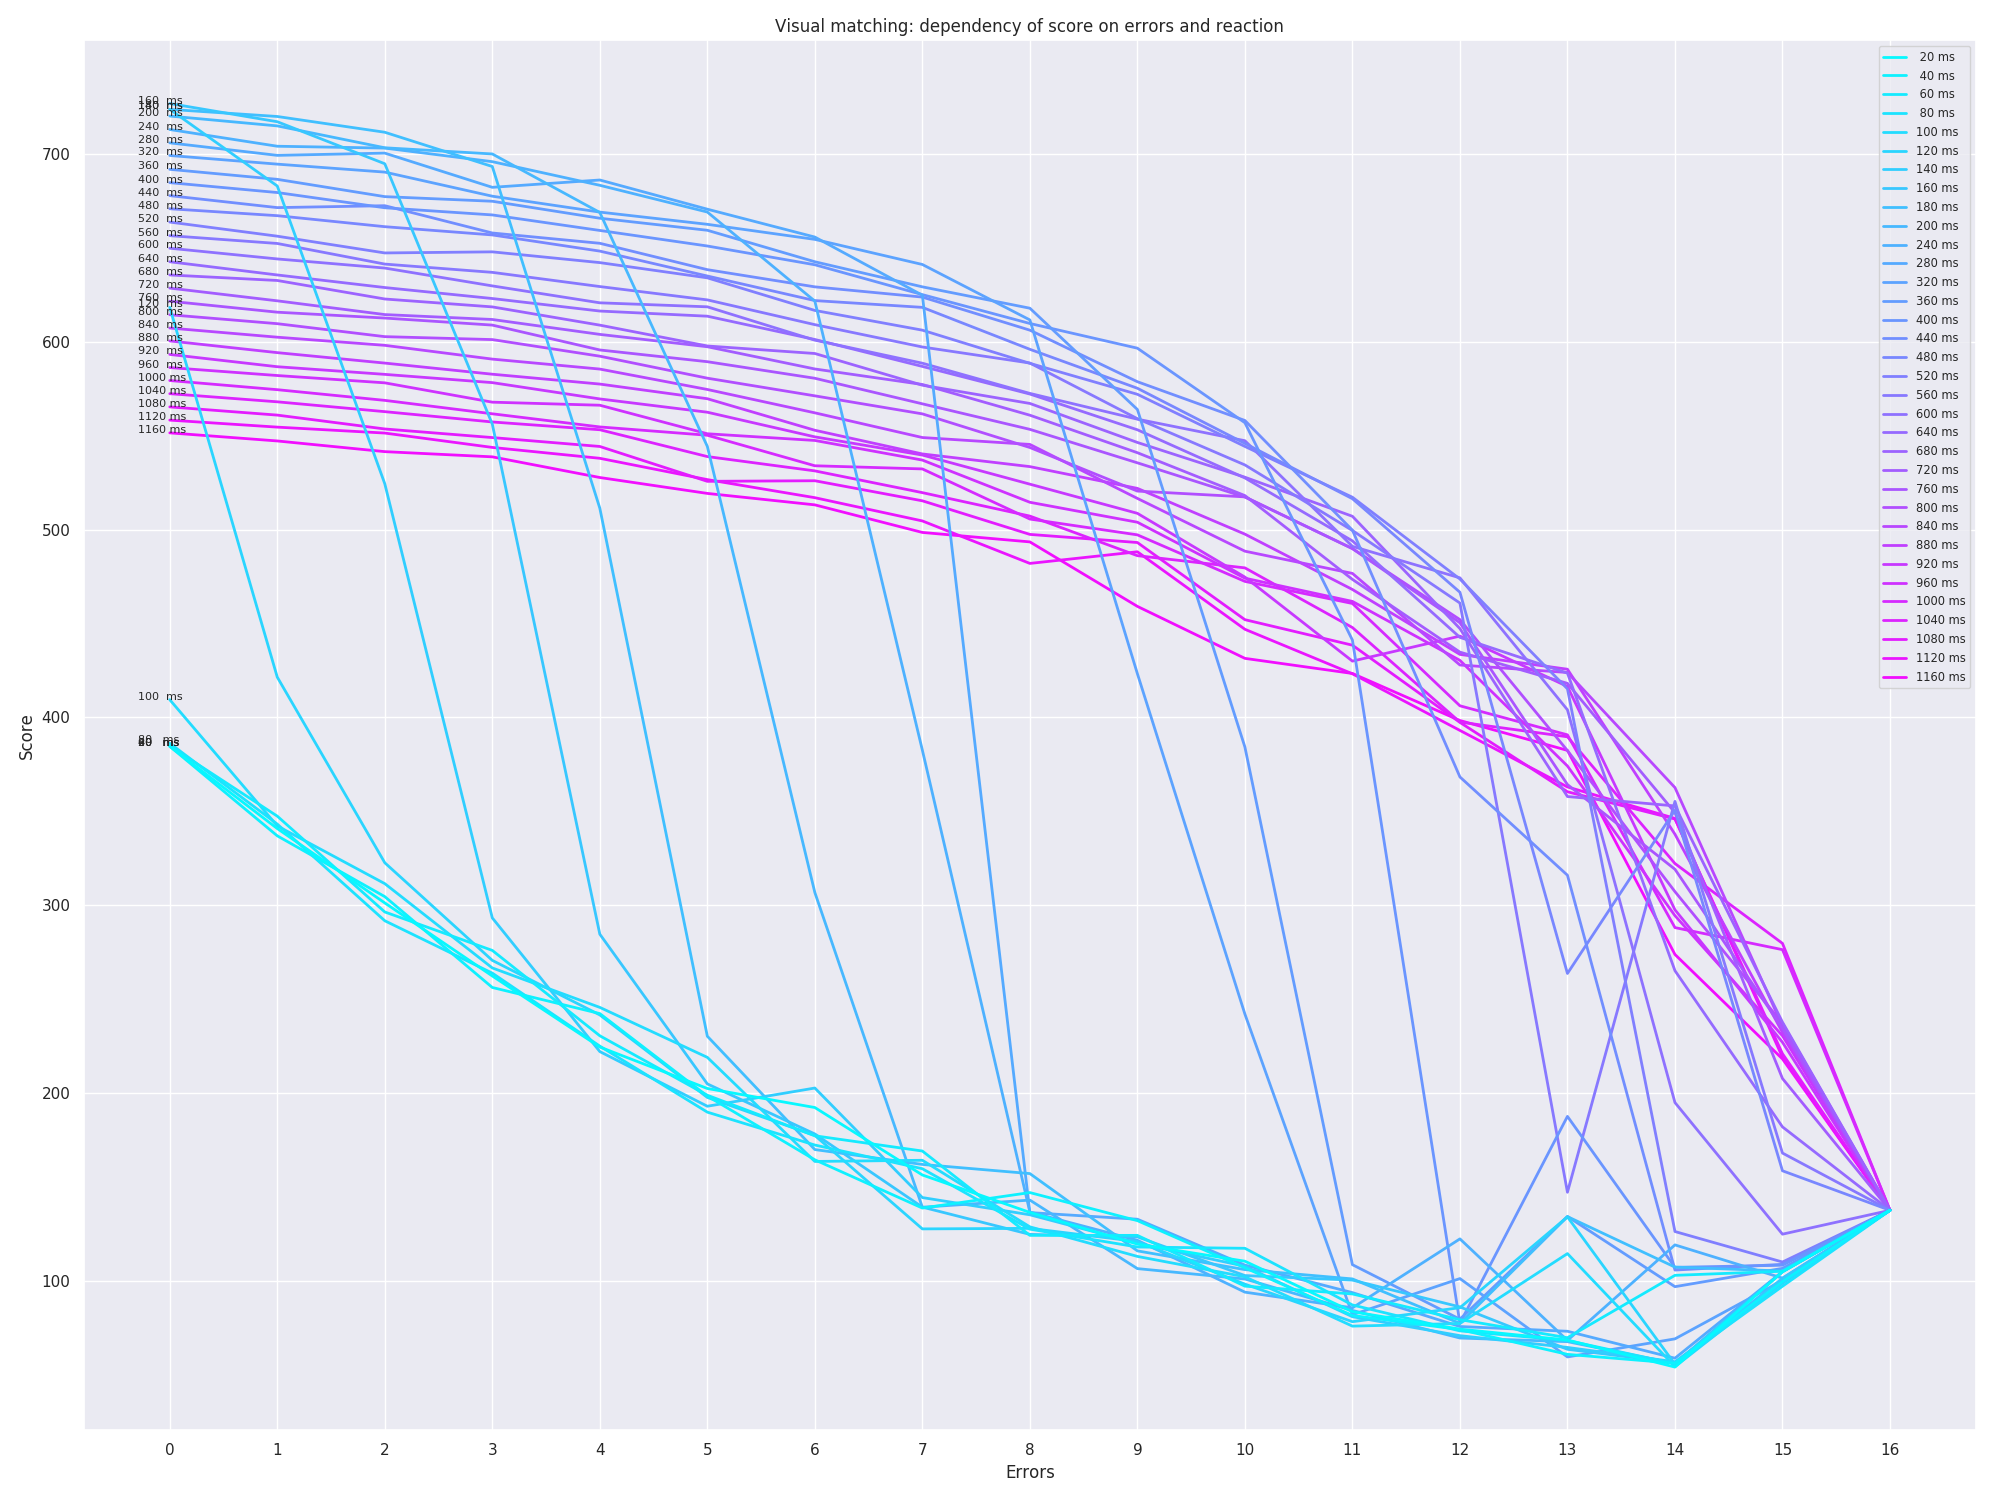
Here is what I got after the simulations (clicking highly recommended):

Observations
Same score could mean different things; you can see it from the plots if you draw horizontal lines, they would intersect multiple curves corresponding to different delays.
So, for instance, if you get score 600 on visual matching, that could mean that you did the test with:
- 880ms reaction and 0 errors, or
- 840ms reaction and 2 errors, or
- 760ms reaction and 4 errors
These are fairly different results and even though it’s good to have some sort of aggregate score, it’s also useful to distinguish. E.g. maybe caffeine makes you less patient so you press early and make more errors.
For low reaction time (<300ms for simple reaction time <600ms for visual matching), the plots don’t look continuous, there are some sudden drops. That’s pretty suspicious IMO.
Perhaps that could explained by the fact that such low times are impossible to get by average humans and they are out of the test domain.
If you keep number of errors fixed, one would expect that score grows as the reaction time goes down. That is not the case on plots, probably related to the artifact above.
If you keep reaction time fixed, you would expect the score to decrease monotonically with the number of errors. You can see that for simple reaction time after 600ms, the score actually monotonically increases as you make more errors. Again, one could argue that reaction of 600 ms is too long for average human on this test (e.g. I score about 230), but I can easily imagine drugs (even such as alcohol) resulting in these scores, which could also be interesting to measure.
If you think about, 8 (out of 16) errors is what you would get on visual matching if you answer completely at random (which you could do with almost arbitrary low reaction time). So if you do that, say, with 400ms delay, according to the plot you would score around 620 points. Which is what I get by doing the test myself with 800ms reaction and making 1 error. So what does the score represent then?
Summary
I can’t see how is that score meaningful and I’m glad I didn’t spend more time doing these tests. Perhaps one is better off measuring reaction time directly instead of some mystical ‘score’.
What’s next?
Could be interesting to do similar reverse engineering on other cognitive testing platforms.